Electricity Prices by State in 2026: Cost per kWh Maps
Residential electricity prices vary dramatically depending on where you live — the cost per kWh by state runs from about 12.35¢ in Idaho to 52¢ in Hawaii, more than a four-fold gap. Below, all 50 US states are mapped and ranked cheapest to most expensive with an illustrative monthly cost for each rate, followed by UK regions under the Ofgem price cap — plus the reasons behind the gaps.

Muhammad founded KilowattKit after spending hours trying to decode confusing electricity bills and realising there were no clear, jargon-free tools for ordinary homeowners. He researches energy rates, solar payback, EV charging, and heat pump economics across the US, UK, Canada, and Australia — sourcing every figure directly from official government and regulatory data.
⚡ Key findings
- 🇺🇸US: Idaho cheapest at 12.35¢/kWh, Hawaii priciest at 52¢ (imported oil) — national average 18.44¢, a 4×+ spread.
- 🇺🇸Cost per kWh by state: the Mountain West and Great Plains are cheapest (Idaho, Utah, Nebraska ~12–14¢); New England, California and Hawaii the priciest.
- 🇬🇧UK: East Midlands cheapest (25.10p); Merseyside, N Wales & Cheshire priciest (27.66p + the highest standing charge).
- 💡Where power is expensive, each grid kWh you avoid is worth more — so at the listed rates a self-consumed solar kWh is worth about 2.7× as much in California as in Idaho, all else equal.
US Electricity Prices by State — Map
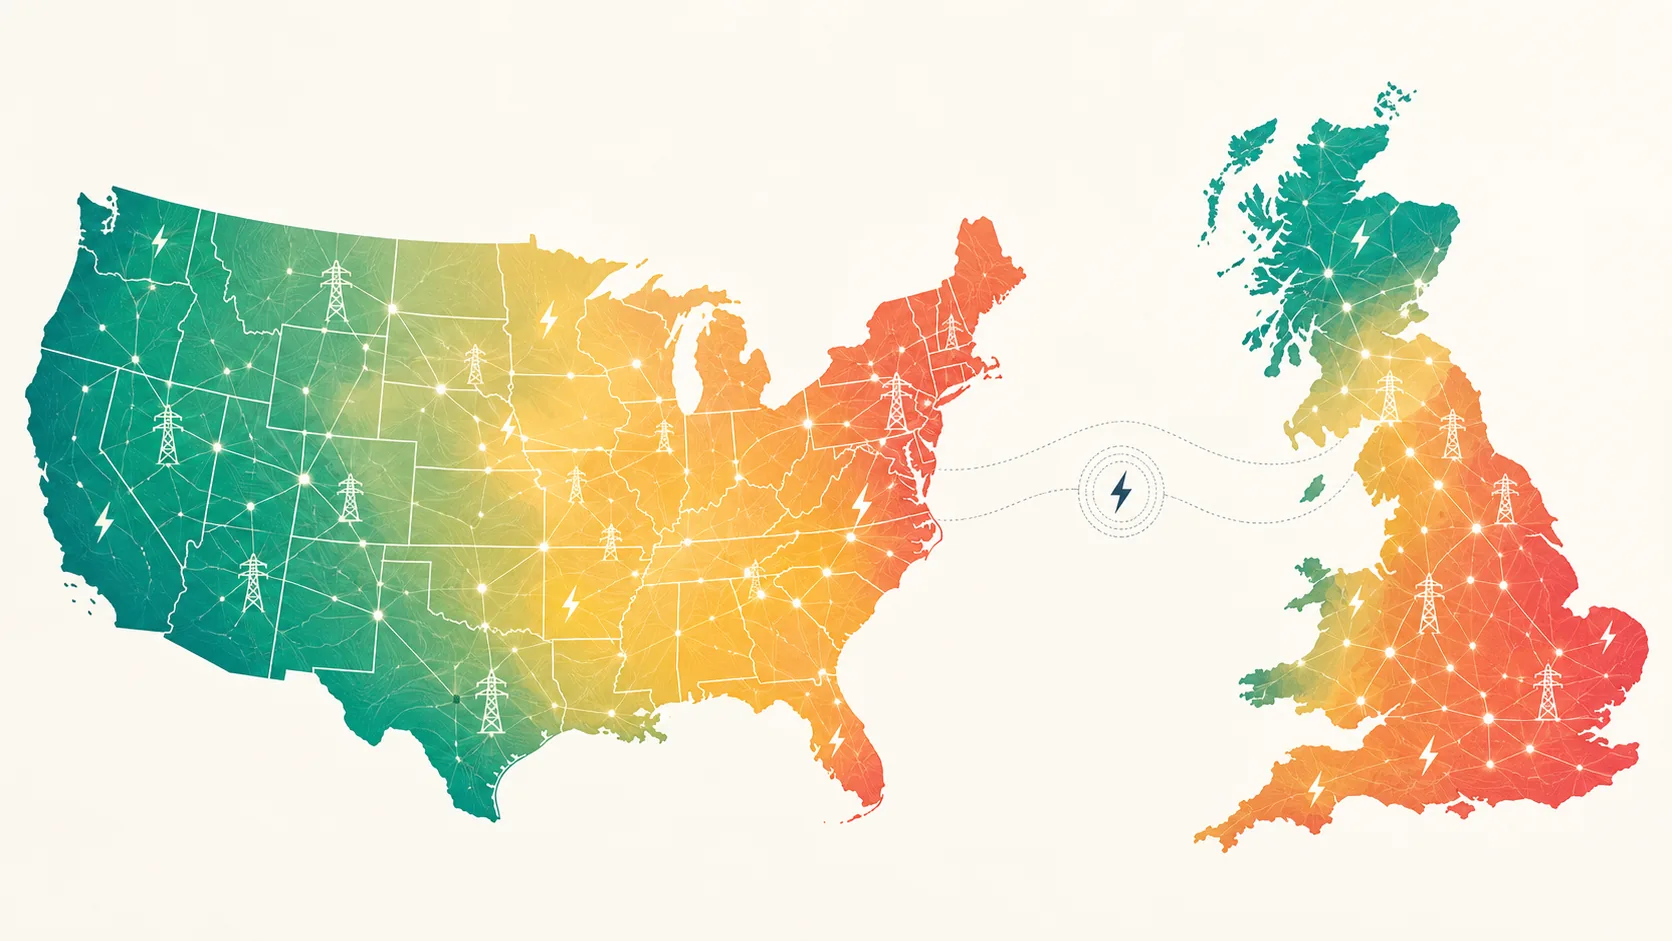
Average residential price, ¢/kWh (EIA, May 2026). Greener = cheaper, redder = pricier. Swipe horizontally to see the full map.
Cost per kWh by State: All 50 States Ranked, Cheapest to Most Expensive
National average: 18.44¢/kWh (EIA, May 2026). The cost column is an illustrative monthly cost at 900 kWh — your own utility tariff may differ, since the EIA rate is a statewide average of revenue ÷ kWh sold, not a specific plan.
| Rank | State | ¢ / kWh | Illustrative cost / mo |
|---|---|---|---|
| 1 | Idaho (ID) | 12.35 | $111 |
| 2 | Utah (UT) | 12.96 | $117 |
| 3 | Oklahoma (OK) | 13.38 | $120 |
| 4 | Nebraska (NE) | 13.59 | $122 |
| 5 | Nevada (NV) | 13.60 | $122 |
| 6 | North Dakota (ND) | 13.61 | $122 |
| 7 | Missouri (MO) | 13.68 | $123 |
| 8 | New Mexico (NM) | 14.12 | $127 |
| 9 | Iowa (IA) | 14.14 | $127 |
| 10 | Louisiana (LA) | 14.15 | $127 |
| 11 | Arkansas (AR) | 14.36 | $129 |
| 12 | Tennessee (TN) | 14.47 | $130 |
| 13 | Montana (MT) | 14.67 | $132 |
| 14 | Wyoming (WY) | 14.80 | $133 |
| 15 | Washington (WA) | 14.95 | $135 |
| 16 | Kentucky (KY) | 14.98 | $135 |
| 17 | North Carolina (NC) | 15.09 | $136 |
| 18 | Kansas (KS) | 15.13 | $136 |
| 19 | Florida (FL) | 15.17 | $137 |
| 20 | Arizona (AZ) | 15.23 | $137 |
| 21 | South Dakota (SD) | 15.73 | $142 |
| 22 | Georgia (GA) | 15.84 | $143 |
| 23 | Colorado (CO) | 16.16 | $145 |
| 24 | Mississippi (MS) | 16.16 | $145 |
| 25 | South Carolina (SC) | 16.18 | $146 |
| 26 | Oregon (OR) | 16.27 | $146 |
| 27 | Texas (TX) | 16.44 | $148 |
| 28 | Alabama (AL) | 16.77 | $151 |
| 29 | West Virginia (WV) | 16.80 | $151 |
| 30 | Minnesota (MN) | 16.95 | $153 |
| 31 | Virginia (VA) | 17.61 | $158 |
| 32 | Indiana (IN) | 18.15 | $163 |
| 33 | Delaware (DE) | 19.38 | $174 |
| 34 | Ohio (OH) | 19.52 | $176 |
| 35 | Wisconsin (WI) | 19.74 | $178 |
| 36 | Pennsylvania (PA) | 21.55 | $194 |
| 37 | Maryland (MD) | 21.77 | $196 |
| 38 | Michigan (MI) | 22.01 | $198 |
| 39 | New Jersey (NJ) | 23.27 | $209 |
| 40 | Illinois (IL) | 23.85 | $215 |
| 41 | Vermont (VT) | 24.89 | $224 |
| 42 | New Hampshire (NH) | 27.33 | $246 |
| 43 | Connecticut (CT) | 27.37 | $246 |
| 44 | Alaska (AK) | 28.23 | $254 |
| 45 | Maine (ME) | 28.63 | $258 |
| 46 | Massachusetts (MA) | 28.82 | $259 |
| 47 | Rhode Island (RI) | 29.46 | $265 |
| 48 | New York (NY) | 29.93 | $269 |
| 49 | California (CA) | 33.25 | $299 |
| 50 | Hawaii (HI) | 52.00 | $468 |
UK Electricity Prices by Region — Map
Electricity unit rate, p/kWh (Ofgem price cap, Jul–Sep 2026, Direct Debit). Greener = cheaper.
All 14 UK Regions, Ranked by Unit Rate
Est. annual electricity cost assumes 2,700 kWh/year plus the daily standing charge. National average unit rate: 26.11p/kWh.
| Rank | Region | Unit p/kWh | Est. cost / yr |
|---|---|---|---|
| 1 | East Midlands | 25.10 | £873 |
| 2 | Northern (North East) | 25.22 | £916 |
| 3 | Yorkshire | 25.31 | £918 |
| 4 | West Midlands | 25.33 | £902 |
| 5 | Southern Scotland | 25.85 | £932 |
| 6 | North West | 26.13 | £879 |
| 7 | South Wales | 26.33 | £922 |
| 8 | London | 26.35 | £875 |
| 9 | Eastern | 26.38 | £909 |
| 10 | South West | 26.39 | £924 |
| 11 | Northern Scotland | 26.42 | £923 |
| 12 | Southern | 26.42 | £895 |
| 13 | South East | 26.67 | £919 |
| 14 | Merseyside, North Wales & Cheshire | 27.66 | £1,005 |
Why the Same Electricity Costs 4× More From One State to the Next
A kilowatt-hour is a kilowatt-hour — the physics is identical in Honolulu and Boise. So why does one cost 52 cents and the other 12? Three forces are the main contributing factors (not a precise breakdown for any single state, which would need location-specific data):
- 1.How the power is made. States leaning on cheap hydro (Washington, Idaho), wind (the Great Plains) or their own gas tend to run cheaper. Hawaii still burns imported oil shipped across an ocean — widely cited as a major reason it tops the ranking.
- 2.The cost of delivery. Long rural lines, wildfire hardening (California), storm repairs and ageing-grid upgrades all land on the bill. This is also why the UK's regional differences exist at all — wholesale energy is priced nationally, but each region's local network charge differs.
- 3.Policy and taxes. Clean-energy programs, efficiency levies and local taxes add a few cents in some places and almost nothing in others.
The practical takeaway: your rate is mostly set by geography, not by your habits. What you can control is how many kilowatt-hours you buy — and the more expensive your rate, the more each one saved is worth.
The UK Twist: Watch the Standing Charge, Not Just the Rate
In the US, the headline ¢/kWh tells almost the whole story. In the UK it doesn't — because every region also carries a fixed daily standing charge you pay before using a single unit. That charge ranges from 44.78p a day in London to 70.76p in Merseyside, North Wales & Cheshire — a £95-a-year gap on the standing charge alone.
So a low unit rate can be undercut by a high standing charge, and vice versa. Low-usage homes should weight the standing charge heavily; high-usage homes care more about the p/kWh. It's the same reason two neighbours on the "same" price cap can see very different bills.
What a High Rate Means for Solar & Efficiency
Here's the flip side of an expensive rate: every self-consumed kWh you avoid is worth more. A solar panel in California offsets electricity worth 33¢/kWh; the identical panel in Idaho offsets 12¢ — so at the listed rates, each self-consumed solar kWh is worth about 2.7× more in California than in Idaho, all else equal. That doesn't translate into a fixed payback ratio, because payback also depends on system price, incentives, sun-hours and how much you self-consume versus export — but the direction is unmistakable.
That's why the "is it worth it?" answer depends heavily on this map: in a high-rate (red) state or region, efficiency and solar clear the bar more easily than the national averages suggest. (A heat pump is a separate calculation — its economics hinge on the fuel it displaces, its efficiency (COP), your climate and install cost, not the electricity rate alone.) Price your own payback at your exact local rate:
Drop your state or region's rate into our calculators to see your true bill, solar payback, and appliance costs — no averages, no email.
How We Calculated These Figures
- 1US: average residential retail price from the EIA Electric Power Monthly, Table 5.6.A, May 2026 — revenue ÷ kWh sold, so a statewide average rather than one tariff. Illustrative monthly cost = rate × 900 kWh.
- 2UK: unit rates and daily standing charges from the Ofgem price cap, 1 July–30 September 2026, Direct Debit, for the 14 GB distribution regions. Est. annual cost = unit × 2,700 kWh + standing × 365.
- 3Maps are tile cartograms — each state or region is one equal cell in its approximate geographic position, coloured by price so the pattern reads at a glance.
A note on comparing currencies: rates are shown in each country's own currency and are not exchange-rate adjusted — the point is where you rank within your own market, since that's the rate your bill and any solar payback actually use.
The US figure is an EIA statewide average and the UK figure is a regulated price cap, so read them as a like-for-like ranking within each market rather than one identical "average paid" number. Your own price depends on your supplier, tariff and exact usage, so treat the map as the lie of the land and your latest bill as the ground truth.